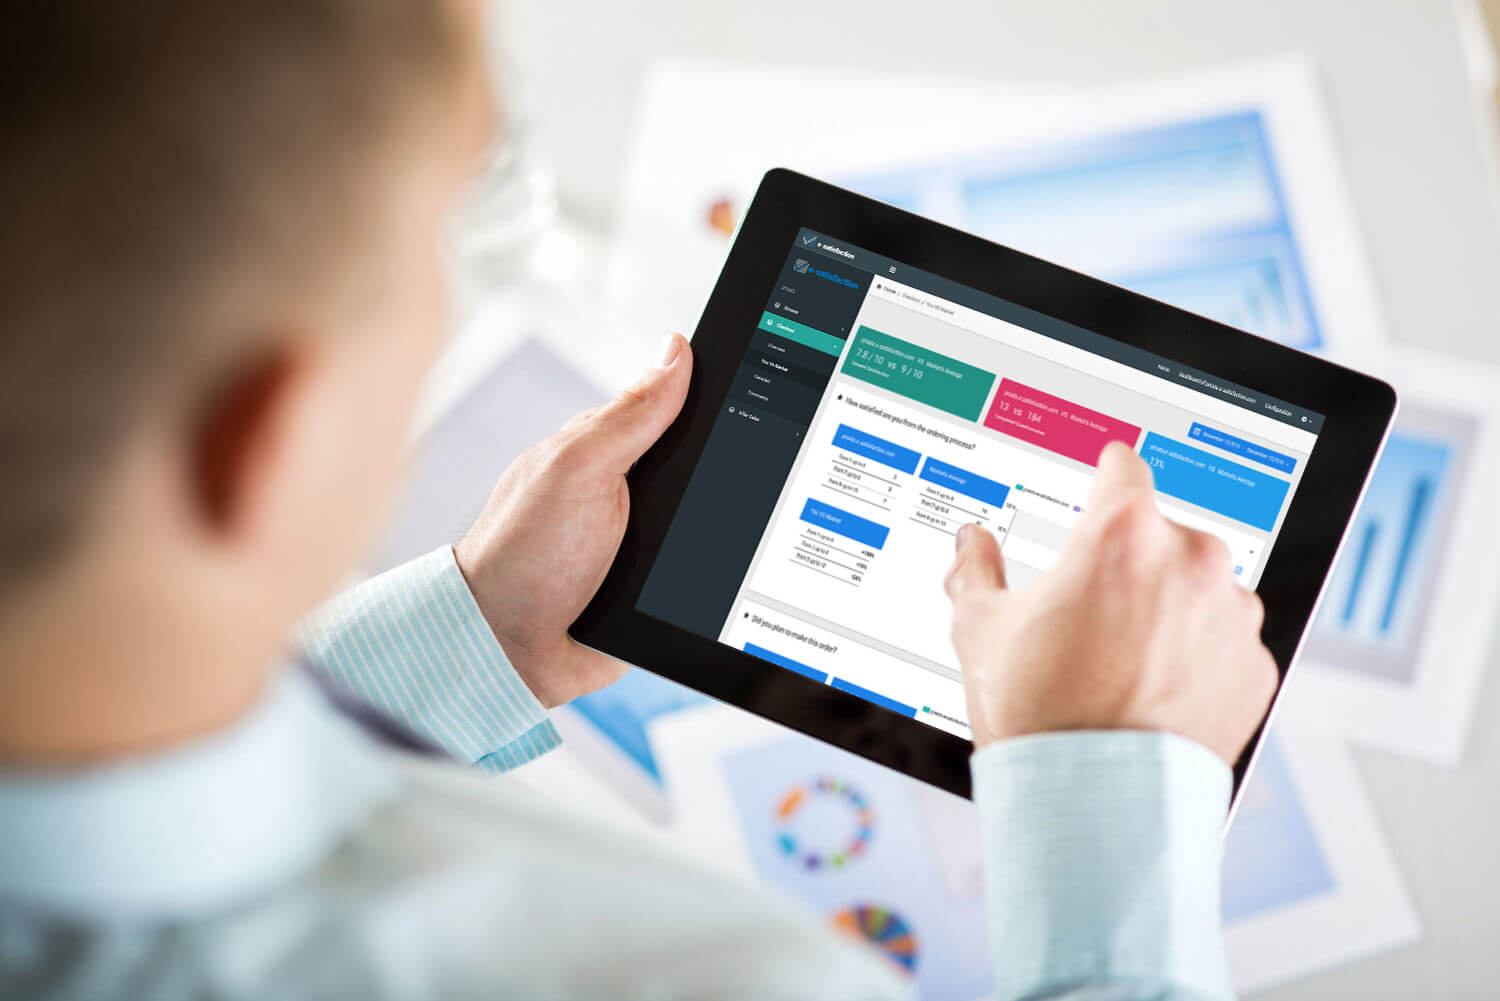
By simply clicking a button you can compare metrics and KPIs of your e-business with the average of hundreds of e-businesses that are using e-satisfaction and use the same set of questions as you do! This is a really powerful mechanism that can be used to diagnose issues in your business or even identify what is the strong element of your business which you can use in your marketing strategy!

In e-satisfaction real-time dashboard, you have the opportunity to compare your performance with industry averages in each customer journey phase separately (Browse, Check out and After Delivery). An overview of your e-Business scores, market’s averages and the difference between your e-Business and the market can be found in easy-to-read charts.
Deep dive into your customers’ feedback!